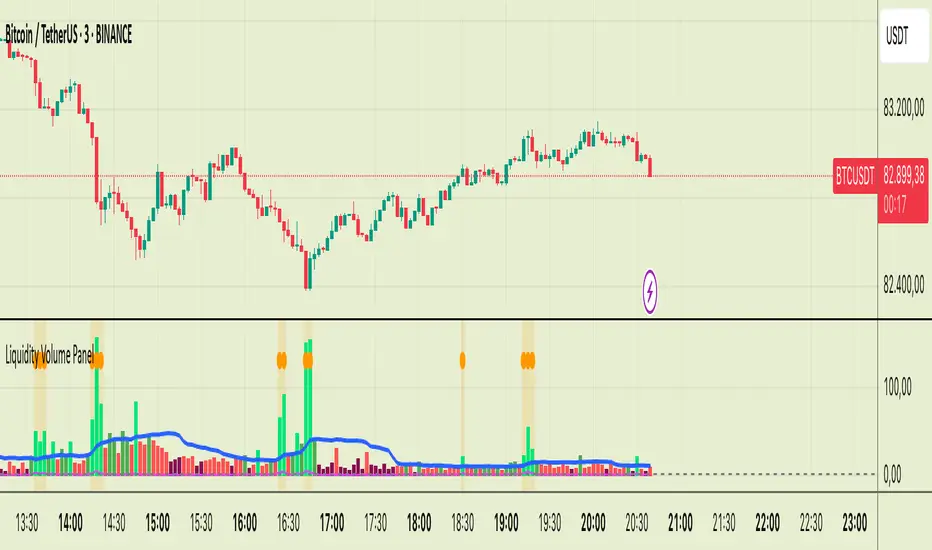
Liquidity Volume Panel Liquidity Volume Panel – Precision Tool for Scalpers & Intraday Traders
This panel is designed to help traders quickly identify volume-driven moves, liquidity events, and fair-value zones. It combines classic volume analysis with enhanced tools like RVOL and VWAP deviation bands, making it ideal for scalping, momentum trading, and intraday strategies.
🔍 Included Features:
✅ Relative Volume (RVOL) Indicator
Displays current volume in relation to its 20-period average – excellent for spotting low-activity zones or high-pressure breakouts.
✅ Dynamic Volume Coloring & Spike Detection
Color-coded volume logic highlights normal, strong, and extremely high volume, with visual markers for volume spikes (>200% of average).
✅ VWAP with ±1σ & ±2σ Bands
Industry-standard deviation bands show overbought/oversold conditions and dynamic support/resistance based on volume-weighted pricing.
✅ Background Highlighting
Subtle orange background alerts you when volume surges beyond extreme levels – making liquidity clusters instantly recognizable.
Usage:
Use this panel as a decision-making tool for entries, reversals, or breakouts – especially in fast-moving markets.
Best used on lower timeframes for precision scalping.
Wyszukaj w skryptach "relative volume"
Candle RvolCandle Rvol is designed to be used on the 10minute chart, using it on other timeframes will result in unintended outcomes.
Candle Rvol has two dynamic features:
- creates and array for every 10m candle over the last 14 trading days, the current candle volume is then compared against the average of the corresponding candles from the past 14 days to give a dynamic relative volume expressed as a percentage (this means the high volume near the open and close does not skew the average volume data)
- for the current candle Rvol percentage, a check is made every 1m during the 10m candle and if the volume is on track to being over 100% the background will dynamically show a green colour.

Renko SR VolumeDaily ATR Renko SR Levels with Volume Analysis is a technical indicator that combines Renko-based support/resistance levels with volume analysis. It dynamically calculates Renko boxes using the ATR (Average True Range) of daily data and identifies key price levels. The indicator:
- Uses daily ATR to determine Renko box size.
- Draws support/resistance levels based on Renko price structure.
- Analyzes volume between levels to assess their strength.
- Colors levels based on relative volume activity:
- Red – strongest level (high volume activity).
- Orange – strong level.
- Yellow – moderate level.
- Green – weakest level (low volume activity).
- Detects daily Renko-based trends.
This tool helps traders visualize key price zones with volume confirmation, improving decision-making in trend and range markets.

Ultimate RVOL IndicatorThe Ultimate Multi-Timeframe RVOL Indicator is designed to provide powerful insights into market activity by analyzing relative volume (RVOL) on both the current and higher timeframes. By tracking volume spikes and comparing them to historical averages, this indicator helps traders detect institutional activity, confirm trends, and avoid false breakouts.
Key Features:
• Real-Time RVOL Analysis: Instantly see how today’s volume compares to the average over a customizable period.
• Multi-Timeframe Support: Monitor RVOL on a higher timeframe (e.g., daily or weekly) to detect significant market moves.
• Smart Alerts: Get notified when RVOL crosses a user-defined threshold, indicating potential breakouts or breakdowns.
• Visual Labels and Background Colors: See clear visual markers for high or low RVOL events.
• Trend Confirmation: Use HTF RVOL to validate the strength of moves on smaller timeframes.
⸻
🚀 How to Use:
1. Identify Strong Trends
• When RVOL > Threshold (e.g., 2x) and HTF RVOL is also elevated, institutions are likely participating.
• This confirms the strength of a move and increases confidence in a continuation.
2. Spot False Breakouts
• If RVOL spikes on your chart but HTF RVOL remains low, it may indicate a retail-driven move.
• Be cautious with these trades as they are more prone to failure.
3. Detect Potential Reversals
• When HTF RVOL spikes while intraday RVOL remains low, institutions may be quietly accumulating or distributing.
• Watch for a reversal or a significant move shortly after.
4. Volume Exhaustion
• A rapid RVOL spike followed by a drop in both RVOL and HTF RVOL may signal trend exhaustion.
• Consider locking in profits or tightening stops.
⸻
⚙️ Settings Guide:
• Lookback Period: Adjust how many bars are used for average volume calculation (e.g., 20 for intraday or 50 for swing trading).
• High RVOL Threshold: Set a multiplier to define what is considered a “high” RVOL. Common values range from 1.5x to 3x.
• Higher Timeframe (HTF): Choose a timeframe to track macro-level volume (e.g., Daily for intraday traders or Weekly for swing traders).
• Show Labels and Alerts: Enable to see clear notifications on volume spikes.
⸻
📊 Pro Tips:
• Use RVOL + HTF RVOL with key support and resistance levels for stronger trade setups.
• Combine with indicators like RSI or MACD to confirm momentum.
• Avoid trading on low RVOL days, as moves may lack conviction.
• When RVOL spikes dramatically, monitor price behavior for confirmation before entering a trade.
⸻
This indicator is ideal for day traders, swing traders, and momentum traders looking to leverage volume for smarter entries and exits. Let the Ultimate Multi-Timeframe RVOL Indicator keep you on the right side of market moves. Happy trading! 🚀

First-Principles Market Structure Explorer - Impulse Finder The goal of this script is to identify meaningful impulses instead of trying to find the trend by looking at volume asymmetry.
The assumption going into making this was that the market is nothing more than impulses followed by directional drift with those impulses eating up large amounts of liquidity in short periods letting drift have a direction.
The First-Principles Market Structure Explorer is a sophisticated TradingView indicator designed to analyze market dynamics by identifying significant price clusters, measuring volatility asymmetry, and evaluating price acceleration. By focusing on fundamental market principles, it provides traders with insights into potential support and resistance zones, as well as the strength of price movements away from these zones.
Key Features:
Price-Level Clustering: Segments recent price data into user-defined bins, assessing volume and time within each bin to identify significant price clusters.
Volatility Analysis: Calculates the standard deviation of price changes over a specified lookback period, distinguishing between upward and downward movements to determine volatility asymmetry.
Price Acceleration Measurement: Computes price acceleration by analyzing changes in price velocity, offering insights into the momentum behind price movements.
Bounce Strength Evaluation: Measures the strength of price movements after exiting significant clusters, aiding in the assessment of breakout or reversal potential.
How to Use:
Configure Input Parameters:
Lookback Length for Clustering: Defines the number of bars to consider for clustering analysis.
Volatility Lookback: Sets the period over which volatility is calculated.
Price Bin Width for Clustering: Determines the granularity of price bins used in clustering.
Min Volume Std Dev for Cluster Significance: Specifies the threshold for a cluster to be considered significant based on volume.
Min Time Persistence Bars: Sets the minimum number of bars a price must remain within a bin to qualify as a persistent zone.
Bounce Strength Lookahead Bars: Defines the number of bars to evaluate after exiting a cluster to measure bounce strength.
Interpret the Plots:
Horizontal Lines: Represent significant price clusters, with color intensity indicating relative volume at each level.
Volatility Asymmetry Plot: Shows the difference between upward and downward volatility, highlighting directional bias.
Bounce Strength Plot: Measures the strength of price movement after leaving a cluster, assisting in evaluating breakout potential.
Limitations:
Historical Analysis: The indicator analyzes past data and may not predict future market movements with certainty.
Parameter Sensitivity: Results can vary significantly based on input parameters; users should adjust settings to align with their specific trading strategies and market conditions.
Notes:
Ensure that the max_labels_count and max_lines_count parameters are set appropriately to accommodate the plotting needs of this script.
Regularly update input parameters to reflect changing market dynamics and maintain the relevance of the analysis.
This indicator is a powerful tool for traders seeking to understand market structure through first-principles analysis, offering a blend of volume, volatility, and price action insights to inform trading decisions.

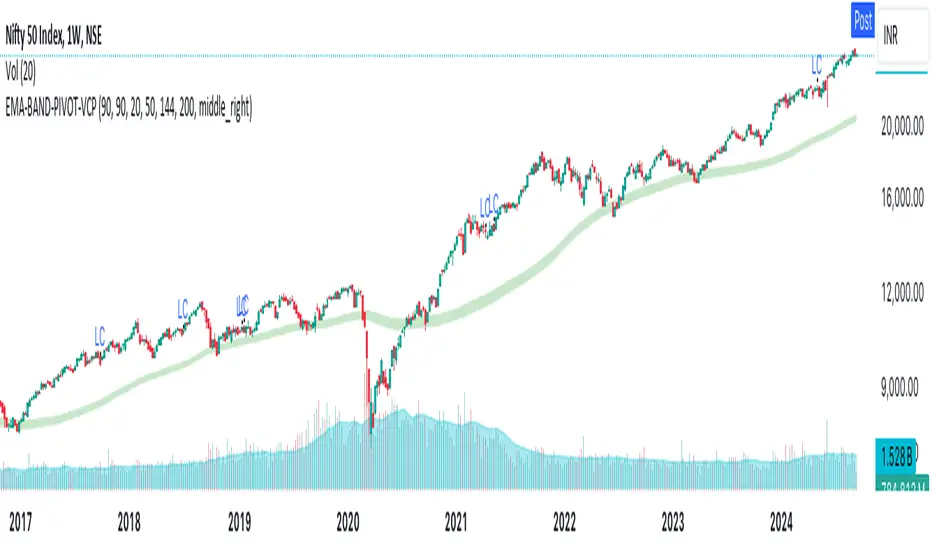
EMA-BAND-PIVOT-VCPThis indicator is named "EMA-BAND-PIVOT-VCP" and integrates multiple elements such as moving averages, volume, volatility contraction patterns (VCP), pivot points, and a table to display key market metrics.
Key Features:
Moving Averages: ( 4 - EMA) default settings 20 , 50 ,144 , 200 . Can be changed in settings.
Pivot Highs and Lows:
The script detects pivot highs and pivot lows using customizable left and right lengths and plots labels to mark these points on the chart.
TIG BAND : This is setting of 2 sma - with the high and low of 90 day average which forms like a band . Its a very strong indicator of trend . Buying is suggestable above this .This has to be tested on your own to knowhow it works wonders ( price magnet). Works on all timeframes . (credit : Bhushan Sir from TIG ) .These are the best buy areas.
Volatility Contraction :
It identifies specific price contraction pattern .
vc marked - used 4 candles - first candle is the mother bar ., 2,3 and 4th candles complete range ( high to low ) is within the range of mother candle.
lc marked -here the closing is considered not the wicks. used 8 candles., the 7 candles closing is within the range of motherbar. Crosses are plotted on the last candle
Table Display:
A table is displayed on the chart with data such as EMA values, relative volume (RVol), Average Daily Range (ADR), and volume ratios. This gives a comprehensive overview of current market conditions.(RVol) compared to the 50-period volume SMA, percentage volume change, and other metrics is also displayed.
TMS By TradeINskiTMS (Trade Management System) By TradeINski
First Things First
- Disclaimer: This indicator will not give any buy or sell signal this is just a supporting tool to improve efficiency in my trading.
- Apply Indicators and then open indicator settings and read the following simultaneously to understand better.
- Default color settings are best suited for light themes. Which is also my personal preference.
Users can change most of the default options in settings according to their personal preference in settings.
- When we open settings we can see 3 tabs that are {Inputs tab} {Style tab} {Visibility tab} each tab have its own options, Understand and use it accordingly.
- Background Color grading that is “Green” background means parameter favorable, “Red” not favorable for my trading, “Nah” and black means no sufficient data for calculation especially IPO stocks and other colors are not just for color grading but also have some significance.
Indicator will be only visible in the intraday time frame as its primary TF is lower time frame.
Contents
Table - Trade Management System
Capital
Risk (%)
Stop Loss (%)
RQBC - Real Time Quantity Based On PDC
%DC - Distance From PDC
RQBL - Real Time Quantity Based On LOD
%DL / %DH - Distance From LOD/ HOD
R_VOL
Markers - Intraday levels
Q - Quantity Based on SL
QL - Quantity Based On LOD
E @ - Entry % Distance From PDC
L1 - Line 1 % Distance From PDC
L2 - Line 2 % Distance From PDC
Low of the Day
Table - Trade Management System
Capital
- Capital is nothing but your account size in number. Default value is 1000000.
- Eg. Capital is 10L then enter 1000000.
{Input Tab}
- “Check Mark” Users can show or hide from the table.
- “Capital” Default “1000000”.
- Color Code of the cell is the default Blue color.
- Note - If Currency is INR then output is in Cr’s and other currency is in thousands K & M for millions.
Risk (%)
- Risk in percentage is the percentage of risk per trade you're willing to take from the deployed capital. Default 0.50%.
- Eg. 10L capital 0.5% Risk (%) ie. 5000 is the risk per trade.
{Input Tab}
- “Check Mark” Users can show or hide from the table.
- “Risk (%)” Default “0.50”.
- Color Code of the cell is the default Blue color.
Stop Loss (%)
- Percentage stop loss willing to take or decided for each specific trade from enter level. Default value is 2%
- Eg. Planned SL for specific trade is 2%.
{Input Tab}
- “Check Mark” Users can show or hide intraday markers.
- “Stop Loss (%)” Default “2%”.
- “Color” Users can change as per their preference. Default color is Red.
RQBC - Real Time Quantity Based On PDC (Previous Day Close)
- Here quantity is calculated real time based on four factors i.e account size, risk (%) and current close and with respect to previous day close. This helps in deciding ideal position size quickly.
- Eg. RQBC is 10 as per Account size, Risk (%), Current close and with respect to Previous day close.
{Input Tab}
- “Check Mark” Users can show or hide from the table.
- “RQBC - Real Time Quantity Based On PDC”. Color code of the cell changes as per % change of the stock i.e Green & Red accordingly.
%DC - Distance From PDC (Previous Day Close)
- This is exact same logic as % change ie. based on two factors which are the previous day close and current close and then % change or move is calculated.
- Eg. Stock has moved 3.5% ie. % change is 3.5%
{Input Tab}
- “Check Mark” Users can show or hide from the table.
- “%DC - Distance from PDC”. Color code of the cell changes as per % change of the stock i.e Green & Red accordingly.
RQBL - Real Time Quantity Based On LOD (Low of the Day)
- Here quantity is calculated realtime based on four factors i.e account size, risk (%) and current close with respect to the low of the day that is today's low. This helps in deciding ideal position size based on the current low of the day quickly.
- Eg. Stock has moved 2.7% from the low of the day which most of the time differs from %DC that is % change.
{Input Tab}
- “Check Mark” Users can show or hide from the table.
- “RQBL - Real Time Quantity Based On LOD”. Color code of the cell changes as per %Change of the stock i.e Green & Red accordingly.
%DL / %DH - Distance From LOD (Low Of The Day) / HOD (High Of The Day)
- This is similar to % change but based on two factors which are the low of the day and current close for %DL that is when %change is positive and when % change is negative %DH is calculated based on current close and high of the day. In both cases, % move is calculated.
- Eg. Stock has moved 3.5% from low of the day then its %DL and for %DH vice versa considering high of the day.
{Input Tab}
- “Check Mark” Users can show or hide from the table.
- “%DL / %DH - Distance from LOD / HOD”. Color code of the cell changes as per % change of the stock i.e Green & Red accordingly.
R_VOL - Relative Volume
- Value shown in terms of percentage, Is how much volume is present today with respect to average volume and average volume period is 50.
- Eg. If R_VOL is less than 100% that means specific day volume is less than average volume and if RVOL is more than average volume then specific day volume is more than average volume.
{Inputs Tab}
- “Check Mark” Users can show or hide from the table.
- “R_VOL” Period “50” - Users have the option to choose accordingly.
- “Op” Means output “Drop down” User can choose between complete & Percentage only Play around to notice the difference.
{Note}
- The Following settings for the complete table.
- Position “Drop Down”. Users can choose accordingly.
- Size “Drop Down”. Users can choose accordingly.
MARKER - INTRADAY LEVELS
{Note}
- The Following settings are for all the intraday markers .
- “Line Type” “Drop Down”. Users can choose accordingly.
- Width ”↕” “1”. Mini = 1 & Max = 4. Users can choose accordingly.
- Label Size “Drop Down”. Users can choose accordingly.
Q - Quantity Based On SL (Stop Loss)
- Here Quantity is calculated based on four factors and marked on an intraday time frame and those factors are capital, Risk (%), Stop loss (%) and E @ ie. Entry level. Objective is based on different factors determining ideal position size quickly.
- Eg. Q is 25 based on capital, Risk(%), Stop loss (%) & Entry (%) Ie E @.
{Inputs Tab}
“Check Mark” Users can show or hide intraday markers.
“Q - Quantity Based On SL”. Color of the marker can be changed from the color settings of E @.
{Output}
- “Q - 25” is marked on E @ - Entry % Distance From PDC.
- Marker is colored green by default.
QL - Quantity Based On LOD (Low Of The Day)
- Here Quantity is calculated based on four factors and marked on an intraday time frame and those factors are capital, Risk (%), LOD ie. low of the day and E @ ie. Entry level. Objective is based on different factors determining ideal position size.
- Eg. Q is 25 based on capital, Risk(%), LOD & Entry (%) Ie E @.
{Inputs Tab}
- “Check Mark” Users can show or hide intraday markers.
- “Q - Quantity Based On LOD”. Color of the marker can be changed from the color settings of E @.
{Output}
- “QL - 25” is marked on E @ - Entry %Distance From PDC.
- Marker is colored green by default.
E @ - Entry % Distance From PDC (Previous Day Close)
- Here Entry Price Level is determined and marked, that is how far from previous day close in percentage that is nothing but saying after how much % change you're willing to enter.
- Eg. Enter after 2% Move then the marker shows its price along with “Q” & “QL”.
{Inputs Tab}
- “Check Mark” Users can show or hide intraday markers.
- E - Entry % Distance From PDC.
- “E @ - Entry (%)” Default “2”. Users have the option to change accordingly.
- “Green Color”. Users can choose as per their preference.
{Output}
- “E @ ” “Default 2%” : “Price” / “Q - ” Calculated Quantity based on SL / “QL - “ Calculated quantity based on LOD. Green Color Label.
L1 - Line 1 % DIstance from PDC (Previous Day Close)
- Here Line 1 is the level which is determined by how far from previous day close in percentage that is nothing but saying at what % change the marker should be shown. This acts as a visual support level. Logic is in the live market the price is nearing the entry level and be vigilant to take action.
- Eg. Support level is 1.5% that is 1.5% away from PDC.
{Inputs Tab}
- “Check Mark” Users can show or hide intraday markers.
- L1 - Line 1 % Distance From PDC.
- “L1 - Line 1 (%)” Default “1.5”. Users have the option to change accordingly.
- “Gray Color”. Users can choose as per their preference.
{Output}
- “L1” “Default 1.5%” : “Price”. Gray Color label.
L2 - Line 2 % Distance from PDC (Previous Day Close)
- Here Line 2 is the level which is determined by how far from previous day close in percentage that is nothing but saying at what % change the marker should be shown. This acts as a visual support level. Logic is in the live market the price is nearing the entry level and be vigilant to take action.
- Eg. Support level is 1% that is 1% away from PDC.
{Inputs Tab}
- “Check Mark” Users can show or hide intraday markers.
- L2 - Line 2 % Distance From PDC.
- “L2 - Line 2 (%)” Default “1.5”. Users have the option to change accordingly.
- “Gray Color”. Users can choose as per their preference.
{Output}
- “L2” “Default 1%” : “Price”. Gray Color label.
Low Of The Day
- Here the current low of the day is marked and its price is shown in the intraday label.
Eg. Stock low of the day is 100 then it marks 100.
{Inputs Tab}
- “Check Mark” Users can show or hide intraday markers.
- Low Of the Day
- “Fuchsia Color”. Users can choose as per their preference.
{Output}
- “LOD” : “Price”. Fuchsia Color label.

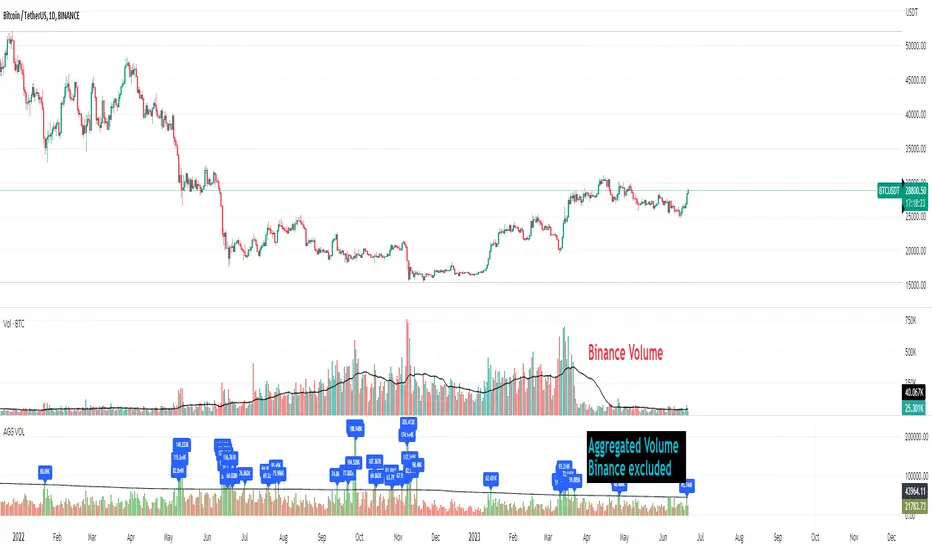
Crypto Aggregated Volume «NoaTrader»If you use volume in your crypto analysis, you may have encountered the situation which an exchange's policy change can affect your judgement falsely. For example, you can see the huge difference of volume on the given chart since binance transferred its fee discount from USDT to TUSD pair.
This script sums up volume of all major centralized exchanges ( according to coinmarketcap ) on the symbol you are visiting and has an option to exclude Binance's volume which can give you a more stable understanding for judgement when needed (and you can see the difference on the chart).
The colors also give a good vision about the relative volume in the area which can show the interest of market in trading.
The script only aggregates the same symbol on different exchanges and does not get the volume from other pairs.
Included CEXs are:
binance
bitstamp
coinbase
huobi
kraken
bitfinex
bybit
okx
kucoin
bithumb
Price based concepts / quantifytools- Overview
Price based concepts incorporates a collection of multiple price action based concepts. Main component of the script is market structure, on top of which liquidity sweeps and deviations are built on, leaving imbalances the only standalone concept included. Each concept can be enabled/disabled separately for creating a selection of indications that one deems relevant for their purposes. Price based concepts are quantified using metrics that measure their expected behavior, such as historical likelihood of supportive price action for given market structure state and volume traded at liquidity sweeps. The concepts principally work on any chart, whether that is equities, currencies, cryptocurrencies or commodities, charts with volume data or no volume data. Essentially any asset that can be considered an ordinary speculative asset. The concepts also work on any timeframe, from second charts to monthly charts. None of the indications are repainted.
Market structure
Market structure is an analysis of support/resistance levels (pivots) and their position relative to each other. Market structure is considered to be bullish on a series of higher highs/higher lows and bearish on a series of lower highs/lower lows. Market structure shifts from bullish to bearish and vice versa on a break of the most recent pivot high/low, indicating weak ability to defend a key level from the dominating side. Supportive market structure typically provides lengthier and sustained trending environment, making it an ideal point of confluence for establishing directional bias for trades.
Liquidity sweeps
Liquidity sweeps are formed when price exceeds a pivot level that served as a provable level of demand once and is expected to display demand again when revisited. A simple way to look at liquidity sweeps is re-tests of untapped support/resistance levels.
Deviations
Deviations are formed when price exceeds a reference level (market structure shift level/liquidity sweep level) and shortly closes back in, leaving participating breakout traders in an awkward position. On further adverse movement, stuck breakout traders are forced to cover their underwater positions, creating ideal conditions for a lengthier reversal.
Imbalances
Imbalances, also known as fair value gaps or single prints, depict areas of inefficient and one sided transacting. Given inclination for markets to trade efficiently, price is naturally attracted to areas that lack proper participation, making imbalances ideal targets for entries or exits.
Key takeaways
- Price based concepts consists of market structure, liquidity sweeps, deviations and imbalances.
- Market structure shifts from bullish to bearish and vice versa on a break of the most recent pivot high/low, indicating weak ability to defend a key level from the dominating side.
- Supportive market structure tends to provide lengthier and sustained movement for the dominating side, making it an ideal foundation for establishing directional bias for trades.
- Liquidity sweeps are formed when price exceeds an untapped support/resistance level that served as a provable level of demand in the past, likely to show demand again when revisited.
- Deviations are formed when price exceeds a key level and shortly closes back in, leaving breakout traders in an awkward position. Further adverse movement compels trapped participants to cover their positions, creating ideal conditions for a reversal.
- Imbalances depict areas of inefficient and one sided transacting where price is naturally attracted to, making them ideal targets for entries or exits.
- Price based concepts are quantified using metrics that measure expected behavior, such as historical likelihood of supportive structure and volume traded at liquidity sweeps.
- For practical guide with practical examples, see last section.
Accessing script 🔑
See "Author's instructions" section, found at bottom of the script page.
Disclaimer
Price based concepts are not buy/sell signals, a standalone trading strategy or financial advice. They also do not substitute knowing how to trade. Example charts and ideas shown for use cases are textbook examples under ideal conditions, not guaranteed to repeat as they are presented. Price based concepts notify when a set of conditions are in place from a purely technical standpoint. Price based concepts should be viewed as one tool providing one kind of evidence, to be used in conjunction with other means of analysis.
Price based concepts are backtested using metrics that reasonably depict their expected behaviour, such as historical likelihood of supportive price movement on each market structure state. The metrics are not intended to be elaborate and perfect, but to serve as a general barometer for feedback created by the indications. Backtesting is done first and foremost to exclude scenarios where the concepts clearly don't work or work suboptimally, in which case they can't be considered as valid evidence. Even when the metrics indicate historical reactions of good quality, price impact can and inevitably does deviate from the expected. Past results do not guarantee future performance.
- Example charts
Chart #1 : BTCUSDT
Chart #2 : EURUSD
Chart #3 : ES futures
Chart #4 : NG futures
Chart #5 : Custom timeframes
- Concepts
Market structure
Knowing when price has truly pivoted is much harder than it might seem at first. In this script, pivots are determined using a custom formula based on volatility adjusted average price, a fundamentally different approach to the widely used highest/lowest price within X amount of bars. The script calculates average price within set period and adjusts it to volatility. Using this formula, the script determines when price has turned significantly enough and aggressively enough to constitute a relevant pivot, resulting in high accuracy while ruling out subjective decision making completely. Users can adjust length of market structure basis and sensitivity of volatility adjustment to achieve desired magnitude of pivots, reflected on the average swing metrics. Note that structure pivots are backpainted. Typical confirmation time for a pivot is within 2-3 bars after peak in price.
Market structure shifts
Generally speaking, traders consider market structure to have shifted when most recent structure high/low gets taken out, flipping underlying bias from one side over to the other (e.g. from bullish structure favoring upside to bearish structure favoring downside). However, there are many ways to approach the concept and the most popular method might not always be the best one. Users can determine their own market structure shift rules by choosing source (close, high, low, ohlc4 etc.) for determining structure shift. Users can also choose additional rules for structure shift, such as two consecutive closes above/below pivot to qualify as a valid shift.
Liquidity sweeps
Users can set maximum amount of bars liquidity levels are considered relevant from the moment of confirmed pivot. By default liquidity levels are monitored for 250 bars and then discarded. Level of tolerance can be set to anything between 100 and 1000 bars. For each liquidity sweep, relative volume (volume relative to volume moving average) is stored and added to average calculations for keeping track of typical depth of liquidity found at sweeps.
Deviations
Users can set a maximum amount of bars price has to spend above/below reference level to consider a deviation to be in place. By default set to 6 bars.
Imbalances
Users can set a desired fill point for imbalances using the following options: 100%, 75%, 50%, 25%. Users can also opt for excluding insignificant imbalances to attain better relevance in indications.
- Backtesting
Built-in backtesting is based on metrics that are considered to reasonably quantify expected behaviour of the main concept, market structure. Structure feedback is monitored using two metrics, supportive structure and structure period gain. Rest of the metrics provided are informational in nature, such as average swing and average relative volume traded at liquidity sweeps. Main purpose of the metrics is to form a general barometer for monitoring whether or not the concepts can be viewed as valid evidence. When the concepts are clearly not working optimally, one should adjust expectations accordingly or take action to improve performance. To make any valid conclusions of performance, sample size should also be significant enough to eliminate randomness effectively. If sample size on any individual chart is insufficient, one should view feedback scores on multiple correlating and comparable charts to make up for the loss.
For more elaborate backtesting, price based concepts can be used in any other script that has a source input, including fully mechanic strategies utilizing Tradingview's native backtester. Each concept and their indications (e.g. higher low on a bearish structure, lower high on a bullish structure, market structure shift up, imbalance filled etc.) can be utilized separately and used as a component in a backtesting script of your choice.
Structure feedback
Structure feedback is monitored using two metrics, likelihood of supportive price movement following a market structure shift and average structure period gain. If either of the two employed tests indicate failed reactions beyond a tolerable level, one should take action to improve feedback by adjusting the settings. If feedback metrics after adjusting the settings are still insufficient, the concepts are working suboptimally for the given chart and cannot be regarded as valid technical evidence as they are.
Metric #1 : Supportive structure
Each structure pivot is benchmarked against its respective structure shift level. Feedback is considered successful if structure pivot takes place above market structure shift level (in the case of bullish structure) or below market structure shift level (in the case of bearish structure). Structure feedback constitutes as one test indicating how often a market structure state results in price movement that can be considered supportive.
Metric #2 : Structure period gain
Each structure period is expected to present favorable appreciation, measured from one market structure shift level to another. E.g. bullish structure period gain is measured from market structure shift up level to market structure shift down level that ends the bullish structure period. Bearish structure is measured in a vice versa manner, from market structure shift down level to market structure shift up level that ends the bearish structure period. Feedback is considered successful if average structure period gain is supportive for a given structure (positive for bullish structure, negative for bearish structure).
Additional metrics
On top of structure feedback metrics, percentage gain for each swing (distance between a pivot to previous pivot) is recorded and stored to average calculations. Average swing calculations shed light on typical pivot magnitude for better understanding changes made in market structure settings. Average relative volume traded at liquidity sweep on the other hand gives a clue of depth of liquidity typically found on a sweeps.
Feedback scores
When market structure (basis for most concepts) is working optimally, quality threshold for both feedback metrics are met. By default, threshold for supportive structure is set to 66%, indicating valid feedback on 2/3 of backtesting periods on average. On top, average structure period gain needs to be positive (for bullish structures) and negative (for bearish structure) to qualify as valid feedback. When both tests are passed, a tick indicating valid feedback will appear next to feedback scores, otherwise an exclamation mark indicating suboptimal performance on either or both. If both or either test fail, market structure parameters need to be optimized for better performance or one needs to adjust expectations accordingly.
Verifying backtest calculations
Backtest metrics can be toggled on via input menu, separately for bullish and bearish structure. When toggled on, both cumulative and average counters used in backtesting will appear on "Data Window" tab. Calculation states are shown at a point in time where cursor is hovered. E.g. when hovering cursor on 4th of January 2021, backtest calculations as they were during this date will be shown.
- Alerts
Available alerts are the following.
- HH/HL/LH/LL/EQL/EQH on a bullish/bearish structure
- Bullish/bearish market structure shift
- Bullish/bearish imbalance created
- Bullish/bearish imbalance filled
- Bullish/bearish liquidity sweep
- Bullish/bearish deviation
- Visuals
Each concept can be enabled/disabled separately for creating a selection indications that one deems relevant for their purposes. On top, each concept has a stealth visual option for more discreet visuals.
Unfilled imbalances and untapped liquidity levels can be extended forward to better gauge key areas of interest.
Liquidity sweeps have an intensity option, using color and width to visualize volume traded at sweep.
Market structure states and market structure shifts can be visualized as chart color.
Metric table can be offsetted horizontally or vertically from any four corners of the chart, allowing space for tables from other scripts.
Table sizes, label sizes and colors are fully customizable via input menu.
- Practical guide
The basic idea behind market structure is that a side (bulls or bears) have shown significant weakness on a failed attempt to defend a key level (most recent pivot high/low). In the same way, a side has shown significant strength on a successful attempt to break through a key level. This successful break through a key level often leads to sustained lengthier movement for the side that provably has the upper hand, making it an ideal tool for establishing directional bias.
Multi-timeframe view of market structure provides crucial guidance for analyzing market structure states on any individual timeframe. If higher timeframe market structure is bullish, it doesn't make sense to expect contradicting lower timeframe market structure to provide significant adverse movement, but rather a normal correction within a long term trend. In the same way, if lower timeframe market structure is in agreement with higher timeframe market structure, one can expect a reliable trending environment to ensue as multiple points of confluence are in place.
Bullish structure can be considered constructive on a series of higher highs and higher lows, indicating strong interest from bulls to sustain an uptrend. Vice versa is true for bearish structure, a series of lower highs and lower lows can be considered constructive. When structure does not indicate strong interest to maintain a supportive trend (lower highs on bullish structure, higher lows on bearish structure), a structure shift and a turn in trend might be nearing.
Market structure shifts are of great interest for breakout traders who position for continuation. Structure shifts can indeed be fertile ground for executing a breakout trade, but breakouts can easily turn into fakeouts that leave participants in an awkward position. When price moves further away from the underwater participants, potential for snowball effect of covering positions and driving price further away is elevated.
Liquidity sweeps as a concept is based on the premise that pivoting price is evidence of meaningful depth of liquidity found at/around pivot. If liquidity existed at a pivot once, it is likely to exist there in the future as well. When price grinds against liquidity, it is on a path of resistance rather than path of least resistance. Pivots are also attractive placements for traders to set stop-losses, which act as fuel for price to move to the opposite direction when swept and triggered.
Behind tightly formed pivots are potentially many stop-loss orders lulled in the comfort of having many layers of levels protecting their position. Compression that leaves such clusters of unswept liquidity rarely goes unvisited.
As markets strive for efficient and proper transacting most of the time, imbalances serve as points in price where price is naturally attracted to. However, imbalances too are contextual and sometimes one sided trading is rewarded with follow through, rather than with a fill. Identifying market regimes give further clue into what to expect from imbalances. In a ranging environment, one can expect imbalances to fill relatively quick, making them ideal targets for entries and exits.
On a strongly trending environment on the other hand imbalances tend to stick for a much longer time. In such environments continuation can be expected with no fills or only partial fills. Signs of demand preventing fill attempts serve as additional clues for imminent continuation.

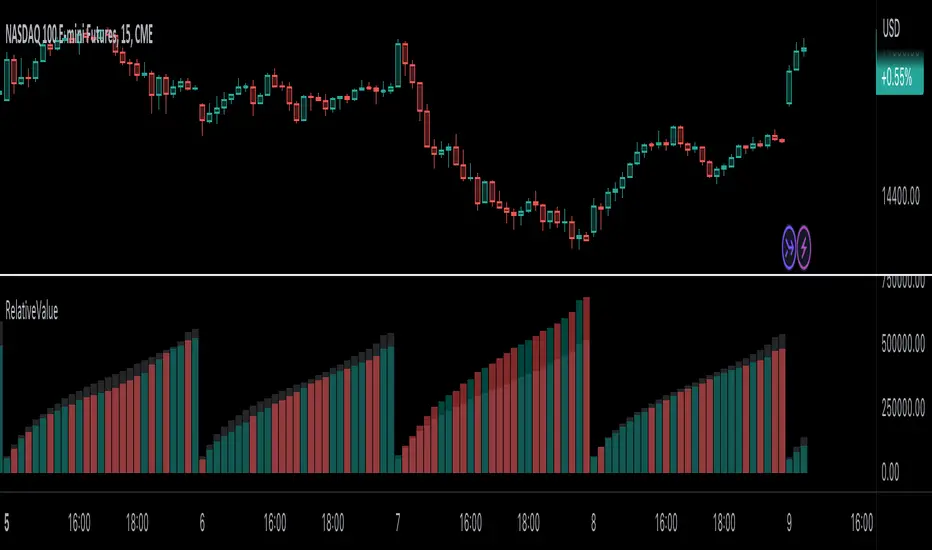
RelativeValue█ OVERVIEW
This library is a Pine Script™ programmer's tool offering the ability to compute relative values, which represent comparisons of current data points, such as volume, price, or custom indicators, with their analogous historical data points from corresponding time offsets. This approach can provide insightful perspectives into the intricate dynamics of relative market behavior over time.
█ CONCEPTS
Relative values
In this library, a relative value is a metric that compares a current data point in a time interval to an average of data points with corresponding time offsets across historical periods. Its purpose is to assess the significance of a value by considering the historical context within past time intervals.
For instance, suppose we wanted to calculate relative volume on an hourly chart over five daily periods, and the last chart bar is two hours into the current trading day. In this case, we would compare the current volume to the average of volume in the second hour of trading across five days. We obtain the relative volume value by dividing the current volume by this average.
This form of analysis rests on the hypothesis that substantial discrepancies or aberrations in present market activity relative to historical time intervals might help indicate upcoming changes in market trends.
Cumulative and non-cumulative values
In the context of this library, a cumulative value refers to the cumulative sum of a series since the last occurrence of a specific condition (referred to as `anchor` in the function definitions). Given that relative values depend on time, we use time-based conditions such as the onset of a new hour, day, etc. On the other hand, a non-cumulative value is simply the series value at a specific time without accumulation.
Calculating relative values
Four main functions coordinate together to compute the relative values: `maintainArray()`, `calcAverageByTime()`, `calcCumulativeSeries()`, and `averageAtTime()`. These functions are underpinned by a `collectedData` user-defined type (UDT), which stores data collected since the last reset of the timeframe along with their corresponding timestamps. The relative values are calculated using the following procedure:
1. The `averageAtTime()` function invokes the process leveraging all four of the methods and acts as the main driver of the calculations. For each bar, this function adds the current bar's source and corresponding time value to a `collectedData` object.
2. Within the `averageAtTime()` function, the `maintainArray()` function is called at the start of each anchor period. It adds a new `collectedData` object to the array and ensures the array size does not exceed the predefined `maxSize` by removing the oldest element when necessary. This method plays an essential role in limiting memory usage and ensuring only relevant data over the desired number of periods is in the calculation window.
3. Next, the `calcAverageByTime()` function calculates the average value of elements within the `data` field for each `collectedData` object that corresponds to the same time offset from each anchor condition. This method accounts for cases where the current index of a `collectedData` object exceeds the last index of any past objects by using the last available values instead.
4. For cumulative calculations, the `averageAtTime()` function utilizes the `isCumulative` boolean parameter. If true, the `calcCumulativeSeries()` function will track the running total of the source data from the last bar where the anchor condition was met, providing a cumulative sum of the source values from one anchor point to the next.
To summarize, the `averageAtTime()` function continually stores values with their corresponding times in a `collectedData` object for each bar in the anchor period. When the anchor resets, this object is added to a larger array. The array's size is limited by the specified number of periods to be averaged. To correlate data across these periods, time indexing is employed, enabling the function to compare corresponding points across multiple periods.
█ USING THIS LIBRARY
The library simplifies the complex process of calculating relative values through its intuitive functions. Follow the steps below to use this library in your scripts.
Step 1: Import the library and declare inputs
Import the library and declare variables based on the user's input. These can include the timeframe for each period, the number of time intervals to include in the average, and whether the calculation uses cumulative values. For example:
//@version=5
import TradingView/RelativeValue/1 as TVrv
indicator("Relative Range Demo")
string resetTimeInput = input.timeframe("D")
int lengthInput = input.int(5, "No. of periods")
Step 2: Define the anchor condition
With these inputs declared, create a condition to define the start of a new period (anchor). For this, we use the change in the time value from the input timeframe:
bool anchor = timeframe.change(resetTimeInput)
Step 3: Calculate the average
At this point, one can calculate the average of a value's history at the time offset from the anchor over a number of periods using the `averageAtTime()` function. In this example, we use True Range (TR) as the `source` and set `isCumulative` to false:
float pastRange = TVrv.averageAtTime(ta.tr, lengthInput, anchor, false)
Step 4: Display the data
You can visualize the results by plotting the returned series. These lines display the non-cumulative TR alongside the average value over `lengthInput` periods for relative comparison:
plot(pastRange, "Past True Range Avg", color.new(chart.bg_color, 70), 1, plot.style_columns)
plot(ta.tr, "True Range", close >= open ? color.new(color.teal, 50) : color.new(color.red, 50), 1, plot.style_columns)
This example will display two overlapping series of columns. The green and red columns depict the current TR on each bar, and the light gray columns show the average over a defined number of periods, e.g., the default inputs on an hourly chart will show the average value at the hour over the past five days. This comparative analysis aids in determining whether the range of a bar aligns with its typical historical values or if it's an outlier.
█ NOTES
• The foundational concept of this library was derived from our initial Relative Volume at Time script. This library's logic significantly boosts its performance. Keep an eye out for a forthcoming updated version of the indicator. The demonstration code included in the library emulates a streamlined version of the indicator utilizing the library functions.
• Key efficiencies in the data management are realized through array.binary_search_leftmost() , which offers a performance improvement in comparison to its loop-dependent counterpart.
• This library's architecture utilizes user-defined types (UDTs) to create custom objects which are the equivalent of variables containing multiple parts, each able to hold independent values of different types . The recently added feature was announced in this blog post.
• To enhance readability, the code substitutes array functions with equivalent methods .
Look first. Then leap.
█ FUNCTIONS
This library contains the following functions:
calcCumulativeSeries(source, anchor)
Calculates the cumulative sum of `source` since the last bar where `anchor` was `true`.
Parameters:
source (series float) : Source used for the calculation.
anchor (series bool) : The condition that triggers the reset of the calculation. The calculation is reset when `anchor` evaluates to `true`, and continues using the values accumulated since the previous reset when `anchor` is `false`.
Returns: (float) The cumulative sum of `source`.
averageAtTime(source, length, anchor, isCumulative)
Calculates the average of all `source` values that share the same time difference from the `anchor` as the current bar for the most recent `length` bars.
Parameters:
source (series float) : Source used for the calculation.
length (simple int) : The number of reset periods to consider for the average calculation of historical data.
anchor (series bool) : The condition that triggers the reset of the average calculation. The calculation is reset when `anchor` evaluates to `true`, and continues using the values accumulated since the previous reset when `anchor` is `false`.
isCumulative (simple bool) : If `true`, `source` values are accumulated until the next time `anchor` is `true`. Optional. The default is `true`.
Returns: (float) The average of the source series at the specified time difference.
TTP Kent Strat PROKent Strat PRO trades breakouts using Bollinger Bands together with SuperTrend.
PRO features:
- 3commas bot alerts for long/short bots
- Custom JSON bots alerts
Features:
- Risk/reward ratio parameter
- Longs, shorts and combined positions.
- Breakout settings
- Trailing SL, trailing TP
- Use of latest candles to place the SL using a lookback parameter (how many candles to look back for a low/high price)
- Select your SL between the ATR trendline and the latest candle: the closest or furthest away value
- Show the trendline
- Backtest mode for accurate backtests
- Signal mode for live price accurate signals
- Date range backtesting
Filters:
- EMA 200 filter and timeframe selector. This filter can be used to trade with the trend: open longs on an uptrend and shorts on a downtrend.
- ADX filter using threshold. This filter can be used to filter entries where the trend is not very strong.
- ADX pointing up. ADX values pointing up and above certain threshold can improve entries.
- Relative volume filter based on the volume being X% above the MA of the Volume. Trading with volume can help filtering out bad trades.
Example setup:
1) pick BINANCE:ETHUSDT chart, 15 min chart
2) trade longs + shorts
3) pick ratio 3
4) trailing SL checked
5) trailing TP unchecked
7) stop loss "furthest"
8) candle loopback 30
9) BB period 21, dev 1, ATR filter on, atr period 5
10) EMA filter on, 15 min
11) ADX off
12) Volume filter on set to 60%

TTP Kent StratKent Strat trades breakouts using Bollinger Bands together with SuperTrend.
Features:
- Risk/reward ratio parameter
- Longs, shorts and combined positions.
- Breakout settings
- Trailing SL, trailing TP
- Use of latest candles to place the SL using a lookback parameter (how many candles to look back for a low/high price)
- Select your SL between the ATR trendline and the latest candle: the closest or furthest away value
- Show the trendline
- Backtest mode for accurate backtests
- Signal mode for live price accurate signals
- Date range backtesting
Filters:
- EMA 200 filter and timeframe selector. This filter can be used to trade with the trend: open longs on an uptrend and shorts on a downtrend.
- ADX filter using threshold. This filter can be used to filter entries where the trend is not very strong.
- ADX pointing up. ADX values pointing up and above certain threshold can improve entries.
- Relative volume filter based on the volume being X% above the MA of the Volume. Trading with volume can help filtering out bad trades.
Example setup:
1) pick BINANCE:ETHUSDT chart, 15 min chart
2) trade longs + shorts
3) pick ratio 3
4) trailing SL checked
5) trailing TP unchecked
7) stop loss "furthest"
8) candle loopback 30
9) BB period 21, dev 1, ATR filter on, atr period 5
10) EMA filter on, 15 min
11) ADX off
12) Volume filter on set to 60%

MZ Adaptive Ichimoku Cloud (Volume, Volatility, Chikou Filter) This study is a functional enhancement to conventionally used Ichimoku Clouds . It uses particular effective adaptive parameters (Relative Volume Strength Index (MZ RVSI ), Volatility and Chikou Backward Trend Filter) to adapt dynamic lengths for Kijun-sen, Tenkan-sen, Senkou-span and Chikou .
This study uses complete available Ichimoku Clouds trading methodology to provide trade confirmations. Its still in experimental phase so will be updated accordingly.
ADAPTIVE LENGTH PARAMETERS
Relative Volume Strength Index (MZ RVSI )
For adaptive length, I tried using Volume and for this purpose I used my Relative Volume Strength Index " RVSI " indicator. RVSI is the best way to detect if Volume is going for a breakout or not and based on that indication length changes.
RVSI breaking above provided value would indicate Volume breakout and hence dynamic length would accordingly make Ichimoku Clouds more over-fitted to better act as support and resistance . Similar case would happen if Volume goes down and dynamic length becomes more under-fit.
Original RVSI Library and study can be found here:
Volatility
Average true range is used as volatility measurement and detection tool. Dual ATR condition would decide over-fitting or under-fitting of curve.
Chikou Backward Trend Filter
Chikou is basically close value of ticker offset to close and it is a good for indicating if close value has crossed potential Support/Resistance zone from past. Chikou is usually used with 26 period.
Chikou filter uses a lookback length calculated from provided lookback percentage and checks if trend was bullish or bearish within that lookback period.
Original Chikou Filter library and study can be found here:
ADAPTIVE ICHIMOKU CLOUD
Tenkan-Sen (Conversion Line)
Tenkan-sen is a moving average that is calculated by taking the average of the high and the low for the last nine periods conventionally but in this study its length is dynamically adapted based on Volume, Volatility and Chikou filter. Default adaption range is set to 9-30 which I found universally applicable to almost every market on all time-frames.
Kijun-Sen (Base Line)
The Kijun-Sen is usually considered a support/resistance line which also acts as an indicator of price movements in the future and takes a longer period into consideration, usually 26 periods compared to Tenkan-Sen’s nine periods is used conventionally. In this study, its length is set to vary in range of 20-60 based on adaptive parameters.
Senkou-Span (Leading Span)
Senkou-Span A : Senkou Span A is the average of the highs and lows of Tenkan-Sen and Kijun-Sen so it automatically adapts accroding to dynamic lengths of Tenkan and Kijun.
Senkou-Span B : Senkou Span B is usually calculated by averaging highs and lows of the past 52 periods and plotting it 26 points to the right but this study uses adaptive parameters to adapt its dynamic length in range of 50-120 which makes Kumo (Ichimoku Cloud) a better area for support and resistance. I don’t consider its necessary to adapt Kumo’s displacement to the right, so I used conventional 26 period as offset.
Chikou -Span (Lagging Span)
The Chikou Span, also known as the lagging span is formed by taking the price source and offsetting it back 26 periods to the left but I used adaptive length in range 26-50 which makes this tool a better option to check for Chikou -Price cross check in wide range.
TRADE SIGNALS & CONFIRMATIONS
Volume : RVSI used to detect volume breakout about given point. By default, On Balance Volume based RVSI is selected for all dynamic length adaption and also for trade confirmations.
Cross(Tenkan,Kijun) : Easiest way to detect trend as if Tenkan is above Kijun then market is uptrend and vice versa.
Volatility : High volatility is a good way to confirm if price is on the move or not.
Tenkan = Kijun : Because of a wide range of Tenkan and Kijun length; their value can become equal before reversal.
Chikou > Source : A very conventional way to detect price momentum as if Chikou is above price then market is in uptrend and vice versa.
Chikou Momentum : Another simpler way to represent Chikou > Source as if momentum of price source is uptrend then price will tend to follow.
Source > Kumo : Using the best tool of Ichimoku Clouds i.e. Kumo. If price crosses both Senkou-Span A & B then market has broken potential resistance leading to a good uptrend and vice versa.
Source > Tenkan : Better way to detect price trend in short term.
Chikou Backward Trend Filter : Different from Chikou >Source in a way that Chikou filter makes sure that price crosses highest/lowest within defined period.
CHARTING
Bars Coloring : Bars coloring is set as following :
src > tenkan-Sen and src > kijun-Sen : Strong uptrend detection and shown by green bars.
src < tenkan-Sen and src < kijun-Sen : Strong downtrend detection and shown by green bars.
src > tenkan-Sen and src < kijun-Sen : Better way to detect bottom reversals as if price comes above tenkan but remains below kijun; that’s early signs of recovery. Light red bars are used for this by default.
src < tenkan-Sen and src > kijun-Sen : Better way to detect top reversals as if price comes below tenkan but remains above kijun; that’s early signs of losing potential in uptrend. Dark Grey bars are used for this by default.
Kumo Coloring : Following steps are used to derive Kumo’s dynamic color:
Average of Senkou-span A and B is calculated.
RSI with 14 period of that average is calculated.
Gradient color based on calculated RSI values with 0-100 range is derived which is final Kumo color.
Chikou Span Coloring : Dynamic coloring from Chikou Filter is used as Indicator’s Chikou ’s color.
Signals Overlay : Red and Green small triangles are used as signals overlay.

[MattLet] Relative Volume for VSAThe Volume Spread Analysis (VSA) methodology focus at the relationship between price, spread, and volume, trying to identify the variations that the price of an asset may have bar by bar, candle by candle.
This indicator is based on calculates on the average volume of the bars in a close environment, that indicates when the volume is Ultrahigh, Very high , High , Normal and low.
The configuration setted is based on personal study. You can configurate the volume ratios per level, and try different results.
The indicator colors the volume bars and candles according to the volume traded.
Base colors configuration is a kind of heat map (don't forget to check the option to paint candles), but you can customize it as you wish.
Good Luck!

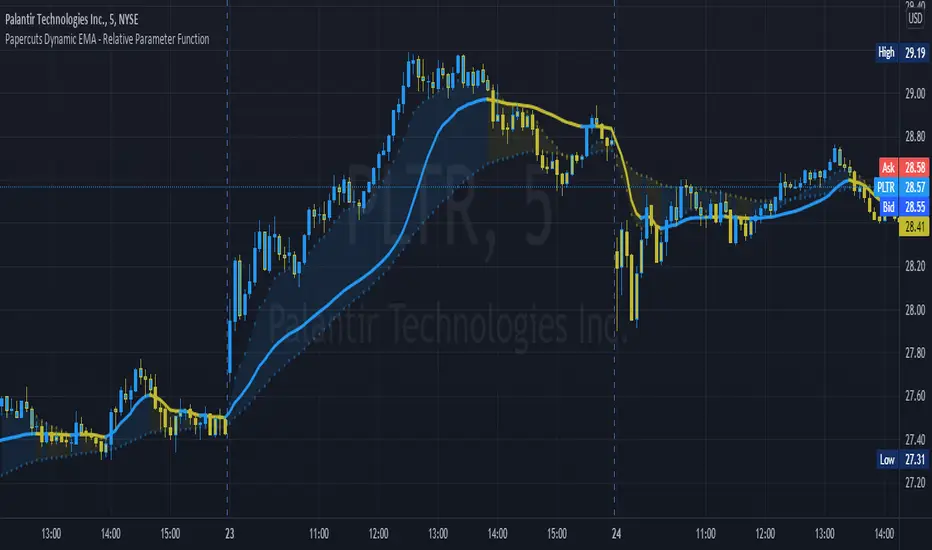
Papercuts Dynamic EMA - Relative Parameter FunctionThe goal of this is to link two parameters of different known low and high values so one affects the other.
In this case, I want to link Relative Volume to the length of an EMA, so it responds faster in times of high volume.
As an animator I am used to linking values in this way with Maya using a set driven key, took some work to figure it out in pine.
Looking up this concept, it has a few names, Relative values, linear interpolation, or rescale values.
Thanks to pinecoders for writing the EMA funciton that can accept length variables!
Here's a quick look at the root function to link the two values.
f_relativeVal(_source, in_bot, in_top, out_bot, out_top) =>
// float _source: input signal
// float in_bot : minimum range of input signal.
// float in_top : maximum range of input signal.
// float out_bot : minimum range of output signal.
// float out_top : maximum range of output signal.
clampSrc = _source > in_top ? in_top : _source < in_bot ? in_bot : _source //claps source to create a controlled range
//relInput = (clampSrc - in_bot) / (in_top - in_bot) * 100
inDiffIncrement = (in_top - in_bot)
outDiffIncrement = (out_top - out_bot)
out_bot + (clampSrc - in_bot) * outDiffIncrement / inDiffIncrement // rescale input range to output range
Angel Algo PremiumAngel Algo provides a set of tools, combined into one solution. Each tool complements each other and is made to uniquely support your trading decisions for your daily trading tasks. You can immerse yourself into our customizable tools to create your own strategies using them.
With Angel Algo you can:
* Find trend direction using three different algorithms designed for trend following, swing and intraday traders.
* Determine market sentiment, overall trends and volume with our full custom dashboard.
* Get real-time support and resistance levels plotted automatically
* Get trend confirmation using one of the two custom candle coloring algorithms
Trading signals
We have 3 different algorithms for entry signals you can choose from
Regular Buy And Sell Signals
Our regular Buy And Sell Signals are finding optimal times to enter for any security. This algorithm uses our original trend filter based on market volatility that adapts to different assets and market conditions.
We give traders the ability to adjust the sensitivity and aggression of these signals to market price changes, as well as the option to make them less sensitive to ranging markets so you can adjust to any market.
We added Auto Best Settings toggle to automatically optimize the settings for you if you'd like.
By adjusting the sensitivity and aggression parameters you can adopt the signal algorithm to different trading styles. For trend following which tries to capitalize on longer trends you should make the signals to be less frequent by adjusting this parameters. The settings that lead to more frequent signals suit to swing trading style.
Strong Signals Algorithm
The Strong Signals use an algorithm based on trend filtering coupled with confirmation signal based on higher time frame trend direction. It finds "Strong" buy or sells that are a tad different from the regular buy & sell signals you will see, a lot of the time they land on top of each other which can be used as an extra confirmation tool. Traders can also use this as a stand alone on higher timeframes.
Angel Intraday algorithm
We constantly try to push Pine script to its limits developing new features. Angel Intraday is our machine learning algorithm in beta that scans for intraday contrarian signals.
To find entry points it forecasts price range for a trading session using linear regression analysis and Kalman filtering.
If an asset is trading 24 hours a day it works with 12 hour sessions, for stocks it forecasts a price range for 7 hour trading sessions which represent the full trading day.
You can use this algorithm to get intraday trading signals for any asset. One of the advantages of this algorithm is that it gives identical signals for all intraday timeframes. The optimal time frames to view the signals and to enter positions are any.
What is the information in our Dashboard?
We offer real-time dashboard showing useful information to analyze market conditions:
- Angel Algo Trend Detection
- Directional Movement
- Angel Cloud for moving average detection
- Relative Volume
- Overall Market Sentiment
All of this information is aimed to help traders understand when the market regime is changing. The first three features help you to judge about trend strength. Relative volume shows current activity of market participants. Overall market sentiment reflects the actual bias for market direction.
Trend weakness, low market activity and neutral sentiment are the signs that can help you in early detecting of ranging market and avoid false trend signals or switch to contrarian mode.
The tools provided by Angel Algo are designed to help you perform rational actions based on the market data in a systematic way and to reduce emotional factor in your trading.
Using this script, please, keep in mind that that past performance does not necessarily represent future results and that there are trading.

Volume Prism RibbonNASDAQ:SPWR
The purpose of this script is to give insight into the volume action. The relative volume is calculated (based on 400 ticks) with the volume of down days (close-close <0) being given a negative value. This function is then summed over 100 ticks. WMA's are used to generate a rainbow ribbon who's color order is easily recognized buy all of us. Watch and Warning points are added using crossover points. I find it to be a good supplement to my favorite Buy/Sell indicator. In addition to the wrapping of the ribbon, pay attention to where the zero line is as well.

Volume Average / Current Volume / ATR On ChartSimple Study to display volume data and atr value on the chart. It will display the relative volume in percentage, an average volume and the current volume and ATR value for the time resolution.
Thank you to @PriceCatch for the ATR code

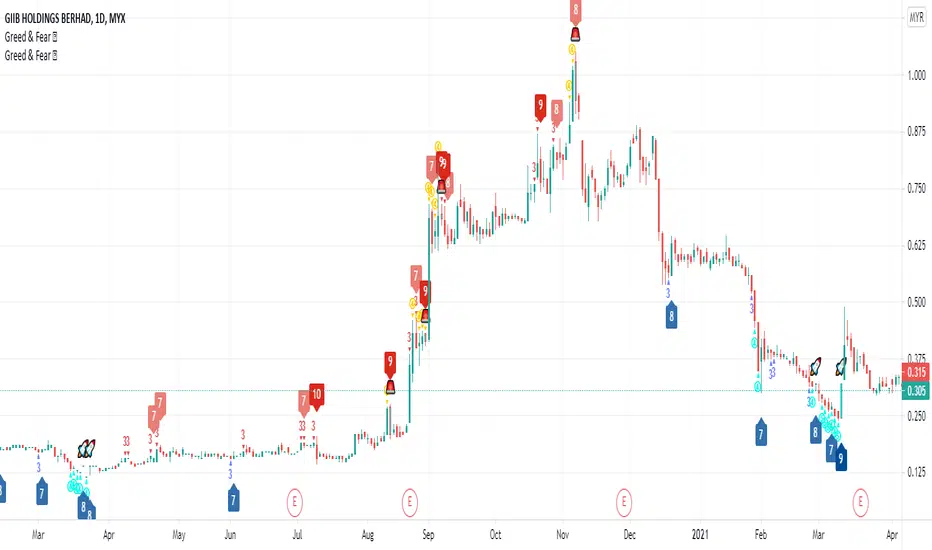
Greed and Fear ScoreHi All,
This is Greed and Fear Score script. The uses of this indicator is to let users know what is the state for each bar closed.
Warren Buffett once said that it is wise for investors to be “fearful when others are greedy, and greedy when others are fearful.
Greed & Fear Score (range from 1 - 5) has taken multiple measurements into consideration such as CCI, MFI, RSI, RVI and William %R.
The range of score is from 1 - 5 indicating weak to strong.
Red/Yellow represents Greed score.
Blue/Light Blue represents Fear score.
The Bull & Bear Transition Score (range from 1 - 10) is to measure how strong power needed to reverse the Greed or Fear State.
It is a powerful tool that incorporates CMF, MFI, CCI, MOMENTUM, OBV, RSI, RVI, WILLIAN %R, PRICE OSCILLATOR and Relative Volume.
How to use Bull & Bear Transition Score?
The higher the Bull & Bear Score, the more likely it will change from one state to another.
How to find BEST opportunity? Here comes the special symbol.
User can choose best fit combination by using filtering.
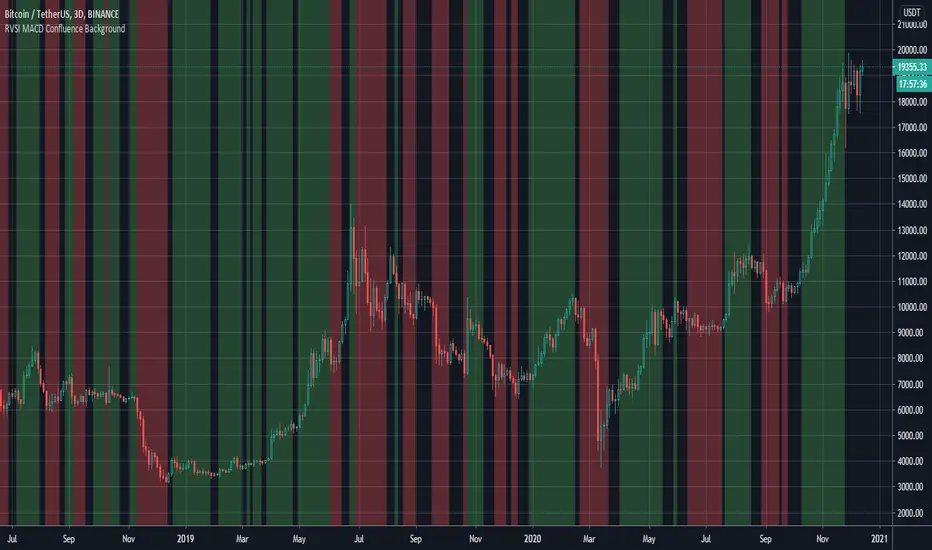
RVSI & MACD Confluence BackgroundThis indicator colors the background in vertical (green/red) stripes to indicate if the current trend is possibly bull / bear
A region where the background is not colored indicates that the present trend can not be identified
The algo combines the RVSI (Relative Volume Strength Index {ref fract} ) and the MACD
The Relative Volume Strength Index has been adapted to include 2 moving averages, one fast and one slow
This same fast slow lookback length is applied to the MACD for simplicity
What's interesting is that there is a very strong confluence between the MACD and RVSI, as the MACD is obtained from 'price action only' and the RVSI from the 'volume only'
So a break in confluence of these two might suggest that the current trend is weakening in confidence or can not be clearly identified
Generally, a green background means consider going long ie price trend is rising
A red background means consider going short ie price trend is falling
An absent background color means - consider exiting current trade or wait to get into a new trade
Best Regards, MoonFlag - and a special thanks/mention to 'fract' for the RVSI algo this is derived from

Volume, Simple Relative Volume HighlightThis script plots volume bars and highlight bars that have an unusual activity, compare to the average (Standard: Simple Moving Average, 50 periods).
The script is useful for checking daily volume levels on equities. Where there is high volume, there is likely volatility, wich is good for day trading and swing trading entries.

Trade LightswitchThis script is a follow-up to the following script:
An analysis shows that when BTC relative monthly volume change of retail is greater than non-retail, non-ideal conditions exist to trade (i.e. do not trade). When the default background color is gray, stay out.
